Skip to Main Content
Menu
Home
About us
lifETIME Programme
lifETIME Aspirations
Animal Free Research UK
Management Structure
Academic Staff
Equality, Diversity and Inclusion
EDI Support
Sustainability
Mentorship Programme
Advice Network
CDT Student Testimonials
Contact us
Researchers
2019 Student Alumni
2020 Student Alumni
2021 Student Alumni
2022 Student Cohort
2023 Student Cohort
Partners
Stakeholder Partners
Industry Partners
Charity Partners
Clinical Regulatory and Manufacturing Partners
Industry Club
Membership
Events
ResearchTogether: Patients Guiding the Future of Science 2027
Previous events
Joint lifETIME | ECMage | BLAST Networking Conference – ‘Young Leaders in Interdisciplinary Ageing Science’
ResearchTogether: Patients Guiding the Future of Science 2023
ResearchTogether: Patients Guiding the Future of Science 2025
Newsletter
Blog
Bottom menu
Home
About us
lifETIME Programme
lifETIME Aspirations
Animal Free Research UK
Management Structure
Academic Staff
Equality, Diversity and Inclusion
EDI Support
Sustainability
Mentorship Programme
Advice Network
CDT Student Testimonials
Contact us
Researchers
2019 Student Alumni
2020 Student Alumni
2021 Student Alumni
2022 Student Cohort
2023 Student Cohort
Partners
Stakeholder Partners
Industry Partners
Charity Partners
Clinical Regulatory and Manufacturing Partners
Industry Club
Membership
Events
ResearchTogether: Patients Guiding the Future of Science 2027
Previous events
Joint lifETIME | ECMage | BLAST Networking Conference – ‘Young Leaders in Interdisciplinary Ageing Science’
ResearchTogether: Patients Guiding the Future of Science 2023
ResearchTogether: Patients Guiding the Future of Science 2025
Newsletter
Blog
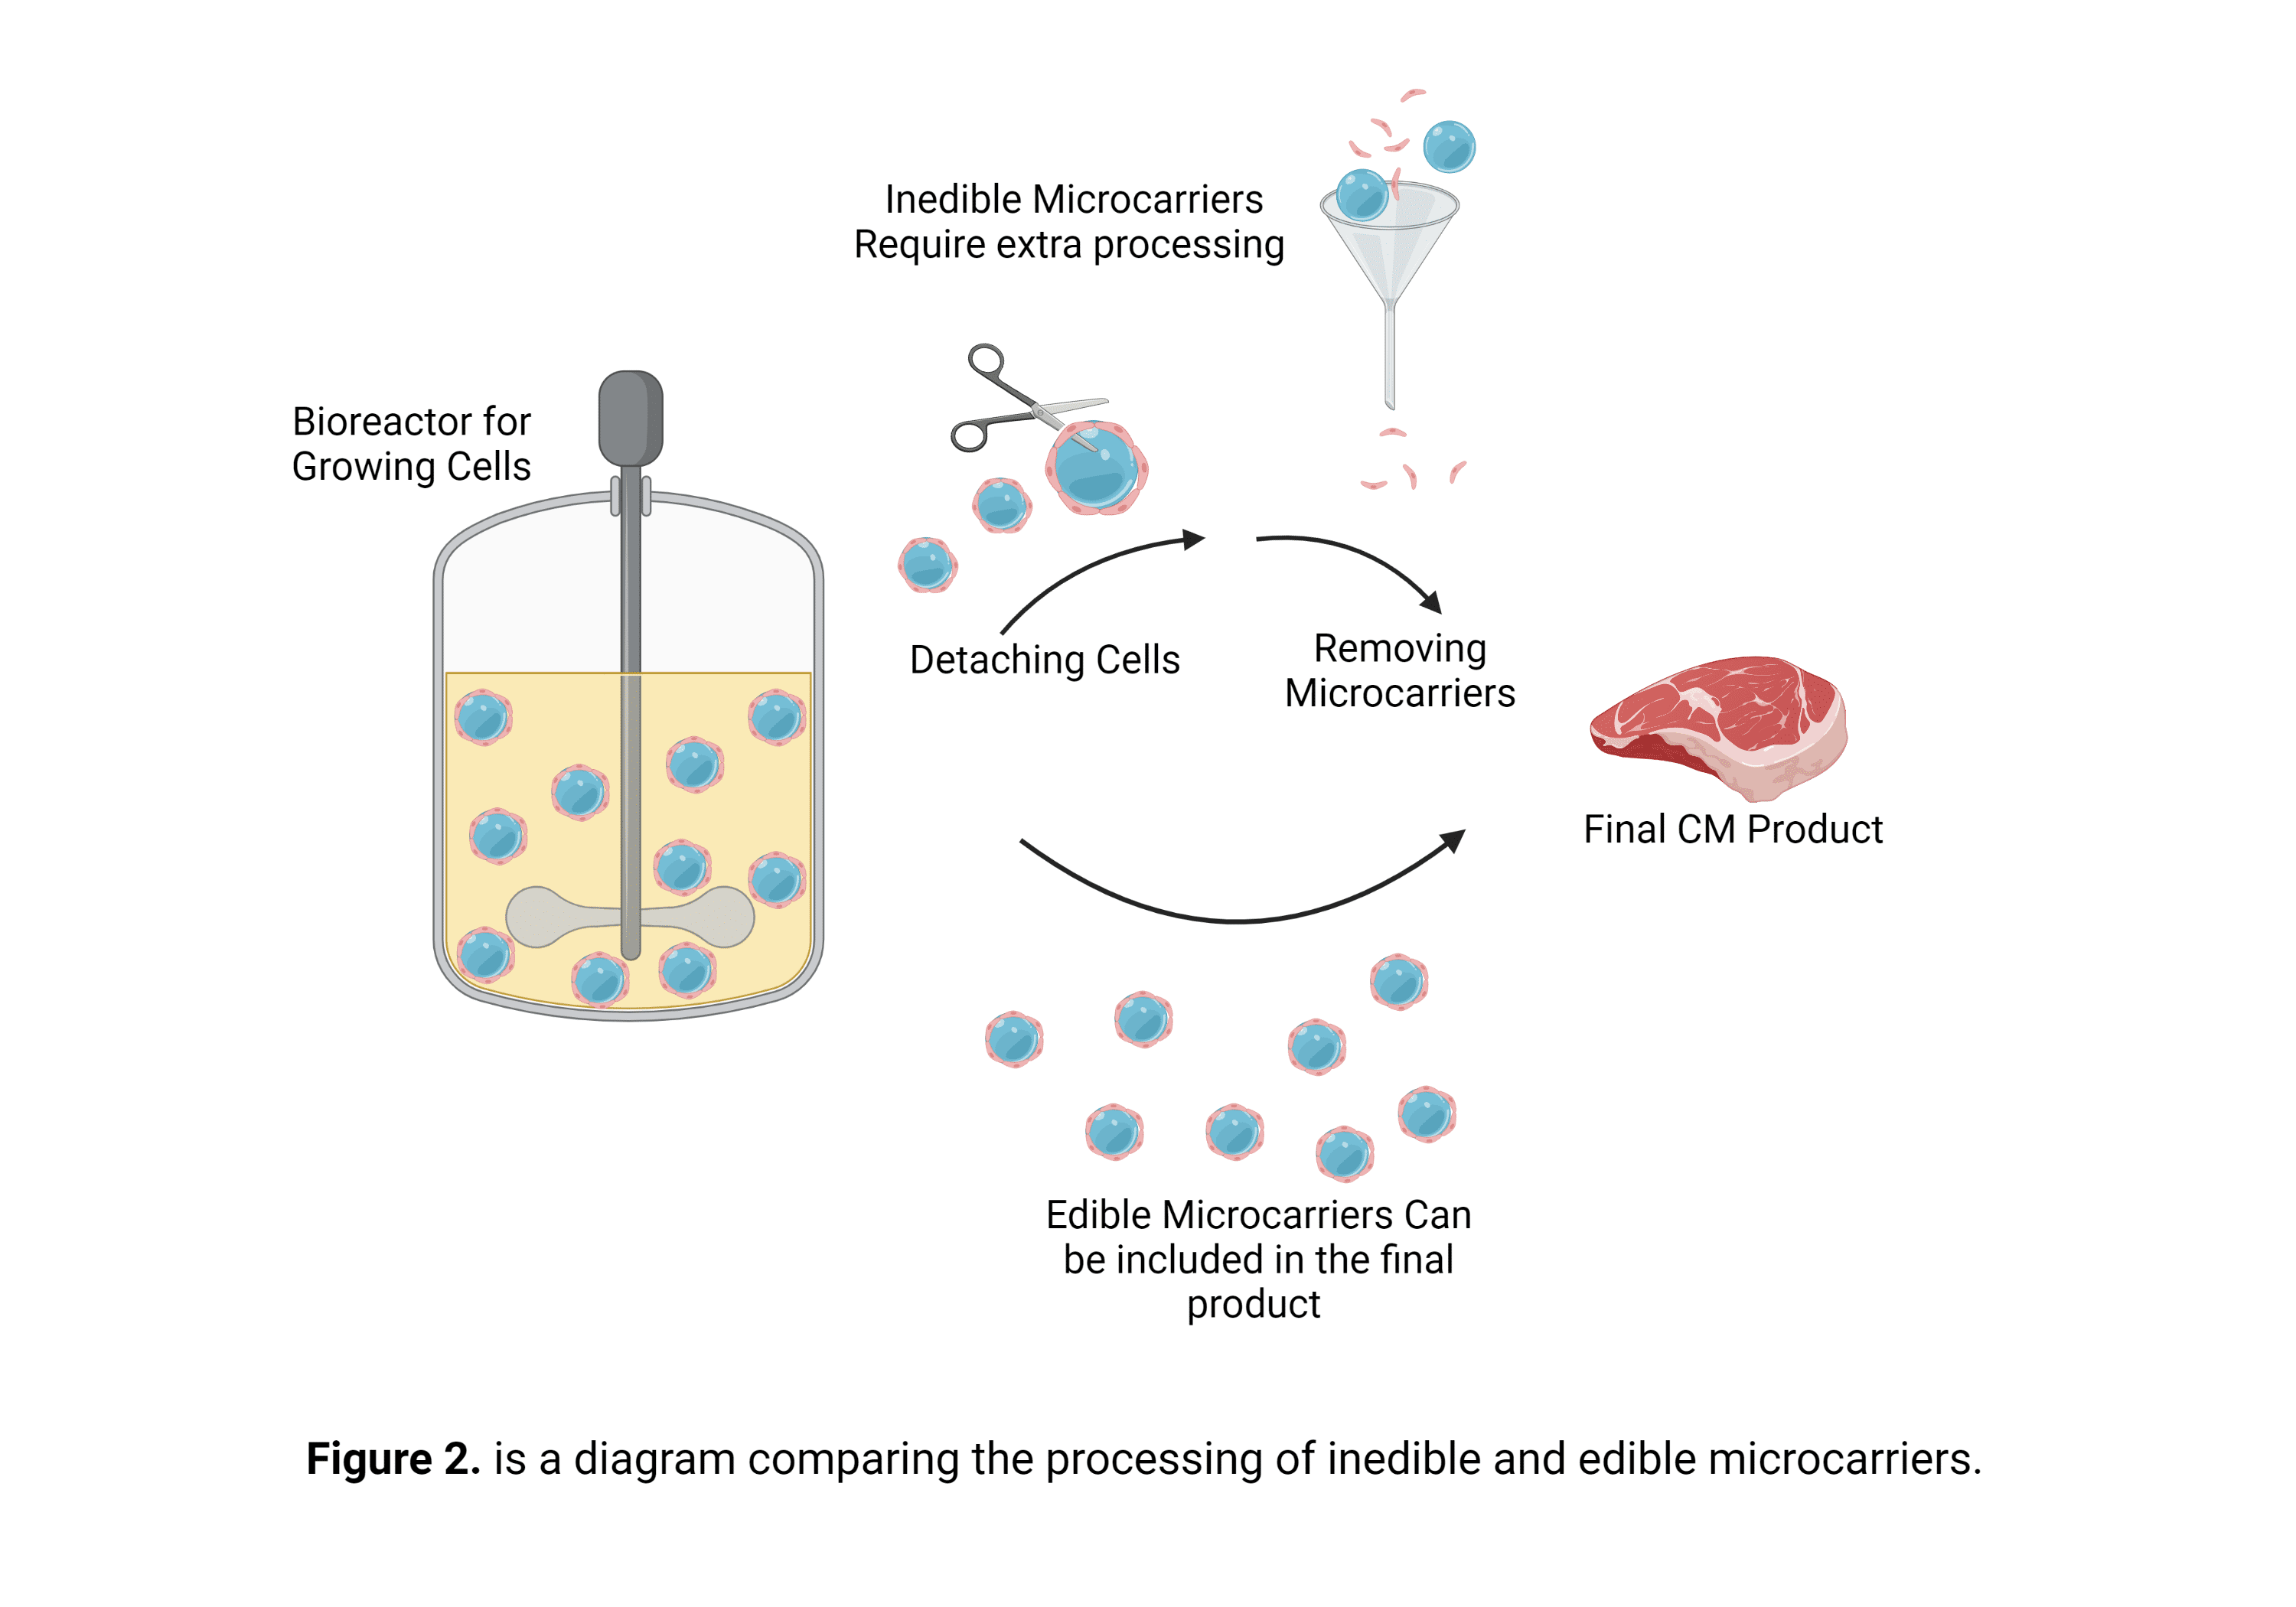
Figure 2
September 19, 2022
,
by
lifETIME Team