Can Raman Spectroscopy Shine a Light on Cancer?
By LifETIME CDT Student: William Mills (University of Glasgow)
In 1930 the Nobel Prize in Physics was awarded to Sir Chandrasekhara Venkata Raman, an Indian Physicist, for his discovery of inelastic scattering of light in organic liquids. Scattering here just means that the direction of the light was changed by hitting a molecule. The reason this was important is because usually light scatters elastically, known as Rayleigh scattering, this means that it bounces off molecules with the exact same wavelength as it came in with.
Raman discovered that very rarely, about 1 in a million photons, light bounces off molecules with a slightly longer or shorter wavelength, now known as Raman scattering. The amount that the wavelength is shifted is dependent on the molecule that the light bounces off, for example a water molecule will cause a specific shift in wavelength while carbon dioxide will cause its own unique shift.
In simple terms, we have a way of detecting and measuring molecules in a sample simply by shining light on it and measuring the scattered light with a different wavelength to the source light. In practice the source light needs to be monochromatic, meaning it’s made up of only one wavelength, so we can use filters to ignore all the elastically scattered light and only detect the inelastically scattered light. We can then plot the intensity of this inelastically Raman scattered light against its wavelength shift to obtain a Raman Spectrum. Figure 1 shows a typical Raman Spectrum, in this case of four different drugs, because of the uniqueness of each chemical’s Raman spectrum it is often referred to as a chemical fingerprint.
![Figure 1 – Raman spectra of four different drugs (Naproxen, Caffeine, Aspirin and Sulfadiazine). Each plotted line shows the relative intensity of the Raman scattered light against the degree to which the wavelength has been shifted from the source light for each of the drugs. Notice how the shape of each drug’s spectrum is unique, hence why the Raman spectrum is often referred to as a chemical fingerprint. Figure reproduced from Wikimedia Commons, the free media repository [1].](https://lifetime-cdt.org/wp-content/uploads/2022/11/figure_1.jpg)
Figure 1 – Raman spectra of four different drugs (Naproxen, Caffeine, Aspirin and Sulfadiazine)
As you can imagine the applications of such a technology are almost endless, from obvious things like use in chemistry to identify molecules, to more left field applications like verifying the authenticity
of valuable historical paintings and artifacts without damaging them.
What my project focusses on is applying this technology to individual cells, so what does the Raman spectrum of a cell tell us? It tells us the molecules present in the cell, what is known as the biomolecular composition of the cell, essentially, we can measure what a cell is making and how much of it it’s making. This is important because the things cells make are indicative of the function of the cell aka it’s phenotype. For instance, the biomolecules in a cancer cell are markedly different to those in a healthy cell from the same tissue. In fact, cancer cells at different stages of progression present different biomolecular compositions and as such present different Raman spectra.
By analysing the Raman spectra of cells, we can tell cancer cells apart from healthy cells and we can separate
cancer cells at different stages of progression [2]. Then we can isolate each analysed cell to perform further tests, such as genetic testing, to investigate which changes in genetics are associated with which changes in a cell’s phenotype. Using this information, we hope to identify new biomolecules unique to cancer cells, especially early-stage cancer cells, to inform new tests for cancer diagnosis or to monitor cancer progression and efficacy of treatment.
One of the main challenges of this project arises from the manipulation of single cells, how do we pick an individual cell, measure its Raman spectrum, move it to where we want it to go and keep it separate from all other cells in a sample? In short, we must use technologies that operate at a similar scale to cells, much like how you wouldn’t use a spade to stir your tea or a teaspoon to dig a hole in the ground, you need the right sized tools for the job.
To pick a cell and hold it in place while measuring it’s Raman spectrum optical tweezers are well suited to the job. Optical tweezers use a tightly focussed laser beam to trap small objects like cells much like how a ping pong ball can be trapped in the focussed air stream of a hairdryer.
Droplet microfluidics can then be used to isolate and collect cells of interest for further testing. Microfluidics uses a network of incredibly thin fluid channels, on the scale of a human hair, like microscopic water pipes. On this scale fluids behave differently to what our macroscopic intuition would tell us. Luckily, they behave more predictably meaning we can design specific shapes and arrangements of channels to perform complex tasks, like how electricity in wires behaves predictably and so we can design electrical circuits to perform complex tasks. Droplet microfluidics involves using two fluids in the device which do not mix, like water and oil, we can then create microscopic water droplets in the oil. These water droplets are perfect for containing and isolating a single cell, the droplet can then be pushed along the channels of the device by the oil and collected for further analysis.
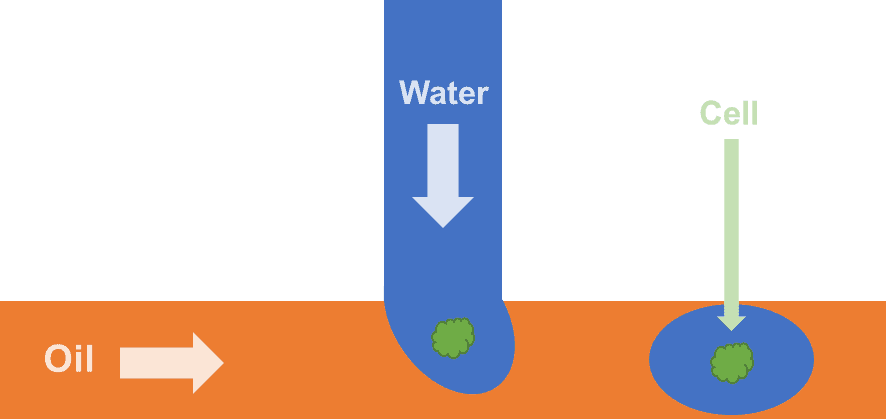
Figure 2 – Schematic diagram of a typical microfluidic water-in-oil droplet generator for encapsulating single cells.
The combination of Raman spectroscopy and single cell manipulation techniques has the potential to yield a powerful single cell sorting and isolation platform which I hope will shine a light on cancer progression and contribute to the advancement of precision and personalised medicine.
Bibliography
[1] B. A. Eckenrode, E. G. Bartick, S. D. Harvey, M. E. Vucelick, B. W. Wright, and R. A. Huff, “File:Raman
spectra of drugs.jpg,” Wikimedia Commons, the free media repository., Jun. 21, 2020.
https://commons.wikimedia.org/w/index.php?title=File:Raman_spectra_of_drugs.jpg&oldid=427947817
(accessed May 02, 2022).
[2] G. W. Auner et al., “Applications of Raman spectroscopy in cancer diagnosis,” Cancer Metastasis Reviews,
vol. 37, no. 4, p. 691, Dec. 2018, doi: 10.1007/S10555-018-9770-9