CVD and Aortic Flow: Lights, Camera, Action!
By LifETIME CDT Student: Eleanor Barton (She/Her) (Aston University)
Cardiovascular diseases (CVD) – you may have heard of these diseases; you probably know someone directly affected by it as there are around 7.6 million people in the UK alone, living with a form of CVD; as reported by the British Heart Foundation. But how does it develop and how can we improve the designs of medical devices to treat it?
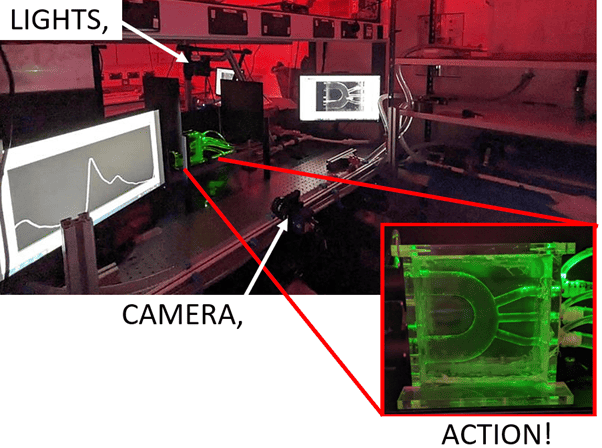
Figure 1: Image of the experimental set up, showing the laser light sheet through the phantom (aortic arch).
CVD is a term used to describe disease present in the heart or blood vessels that make up the cardiovascular system. The cardiovascular system is a series of pipes (blood vessels) branching into every part of the body which blood flows through. Blood flow is vital to ensure that oxygen and nutrients are delivered to your organs, tissues, and cells.
It has been shown that fluid mechanics values can indicate and influence the development of CVD. For example, a common form of CVD called atherosclerosis can develop due to regions of low velocity flow, resulting in the accumulation of a type of protein – often referred to by doctors as “bad cholesterol”. This accumulation migrates to the inner wall of the blood vessel and instigates the body’s inflammatory response. This can result in fatty streaks lining the walls of the blood vessels, resulting in an obstruction or even a complete blockage to the blood flow. So, you may think regions of high velocity blood flow must be good then – unfortunately not. Regions that are too high, near the inner layer of the blood vessel wall, will damage the cells that make up the blood vessel wall, weakening it. This can lead to an expansion/bulging of the vessel, known as an aneurysm; or it can lead to dissection, a tear in the inner layer of the blood vessel wall forming a gap that blood flows through but cannot flow out of. All these diseases disrupt regular blood flow when present in the aorta (the major blood vessel that leaves the heart, transporting oxygen and nutrients to the whole body) and have a far greater impact on the rest of the cardiovascular system.
Diseased sections of the aorta can be treated with medical devices called vascular grafts. These are tubes made of metal wire and woven fabric (both biocompatible) that can be implanted to replace the diseased blood vessel tissue. Aiding in the return of regular, more healthy blood flow through the aorta and subsequently the rest of the body.
Currently, designs of vascular grafts can be tested computationally, where the forces and flow conditions it experiences can be applied, and the resulting velocity of the blood flow through it can be simulated. However, with simulations for safety reasons the regulations state a comparator is required before ever implanting a medical device only tested on a computer. This is where my PhD project comes in, with the aim of developing an experimental model for testing the designed vascular grafts to validate the simulation results.
This experimental model (pictured in Figure 1) has 3 key components: a phantom – to match the geometry of the patients’ aorta both with and without a vascular graft, a flow circuit – to ensure the phantom experiences physiological flow conditions as it would if in the body, and an optical imaging system – to capture the velocity flow data, the technique used is called Particle Image Velocimetry (PIV).
PIV is carried out by seeding the fluid going through the flow circuit with glass particles and shining a laser light sheet through the phantom. The light is scattered when it hits the particles. This light is captured by the camera in two pictures, with a known time difference between the first and second image, so that after further processing, the distance a particles travel between the two images can be divided by the time difference to get the velocity of the particle and therefore the velocity of the flow transporting them. Velocities can be visually presented with a colour scale (Figure 2), to show regions of low or high velocity. Velocity values are then used in further calculations to obtain key fluid mechanics values. These can indicate the development of CVD in a patient’s aorta geometry or determine how well the vascular graft geometry will improve the blood flow instead of the diseased section of the blood vessel wall.
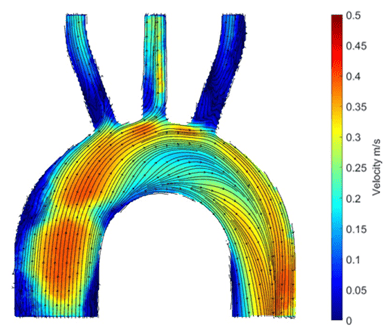
Figure 2: Image of particle image velocimetry results showing the velocity values of the flow in the phantom.
This experimental model will impact the field of designing and testing medical devices, specifically in the industry of cardiovascular devices. As well as help in furthering the understanding of fluid mechanics and its biological implications in the cardiovascular system. Aiding in the fight against CVD by enabling the validation of vascular graft designs, with the potential of improving the method for tailored vascular grafts. Resulting in an improved performance of the medical device and most importantly the outcome for the patient!